What is Autochartist
As a world’s leading tool in the field of automatic identification of trade opportunities, Autochartist is something you shouldn’t let go past yourself unacknowledged. This Metatrader plug-in offers you an opportunity to redefine your trading habits and outcomes. And on the top of that, if you have a live account opened with Axiory, it comes for free!
Thanks to its search engines which monitor thousand of financial instruments 24 hours per day it’s able to deliver real-time trading opportunities in the form of the Chart pattern formations, Fibonacci patterns, and Key Levels straight into your terminal.
Apart from Chart Pattern formations, Fibonacci patterns, and Key Levels, Autochartist offers also Volatility Analysis. Thanks to it trader should be able to confidently set stop-loss and take-profit levels based on the provided statistical information on the instruments he trades. This ultimately leads to a better assessment of risk and volatility.
Benefits
TECHNICAL PROWESS: The capacity of analyzing massive quantities of data, processing them into various Chart Pattern formations, Fibonacci patterns, Key levels, and Volatility Analysis, as well as being highly customizable at the same time.
Learning how to use various Autochartist features can take some time. In order to minimize the duration of this process, Autochartist offers inbuilt learning guides and video tutorials. Check them out!
INTRADAY SCANNING THAT SAVES TIME: Thanks to Autochartist you won’t miss potential daily trade opportunities as you will be notified about each one of them early enough. This will also save you time that you would have normally devoted to technical analysis.
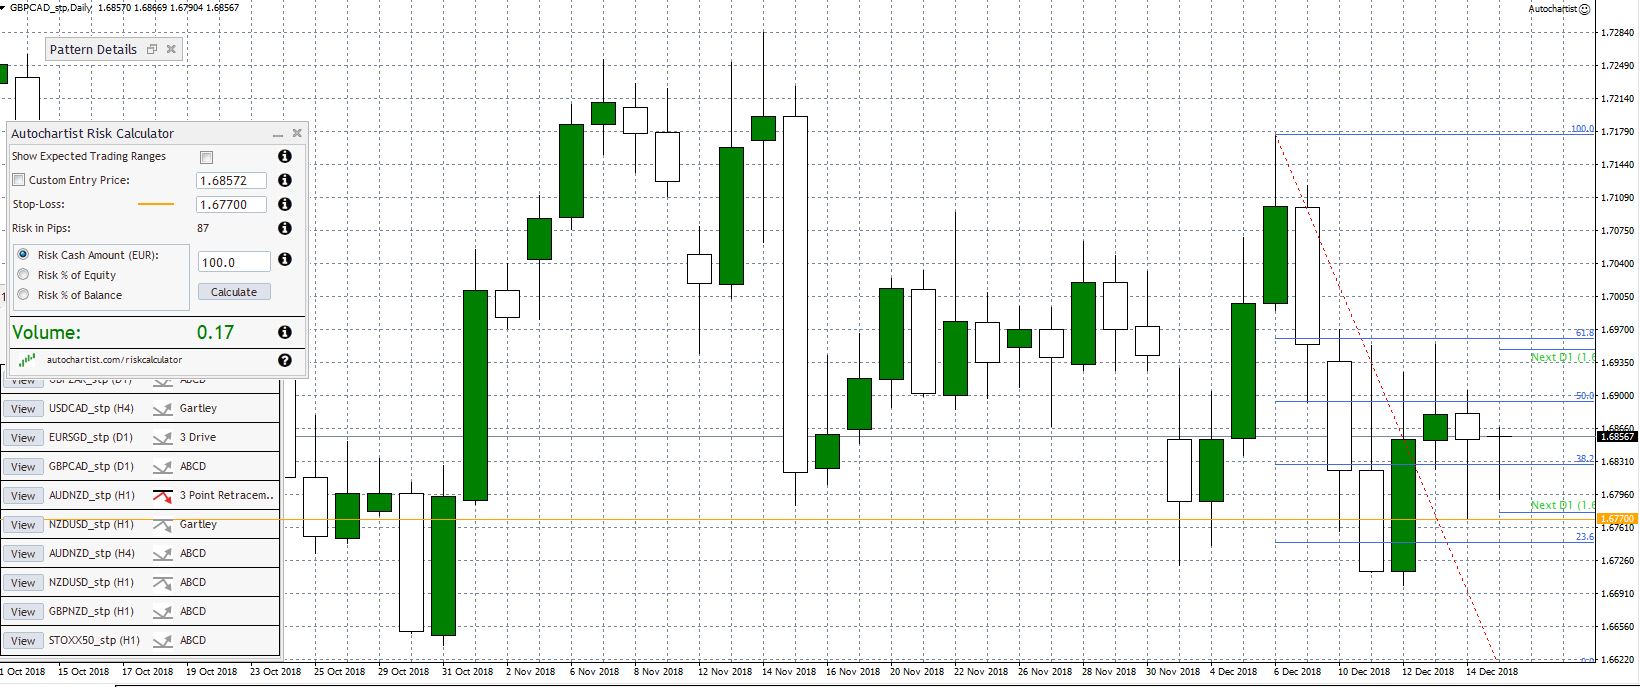
TRADE OPPORTUNITY FORECAST ZONES: Automatically plotting a forecast zone on completed patterns whenever there’s at least a 70% chance that certain price level is expected to be reached… that’s also something Autochartist does.
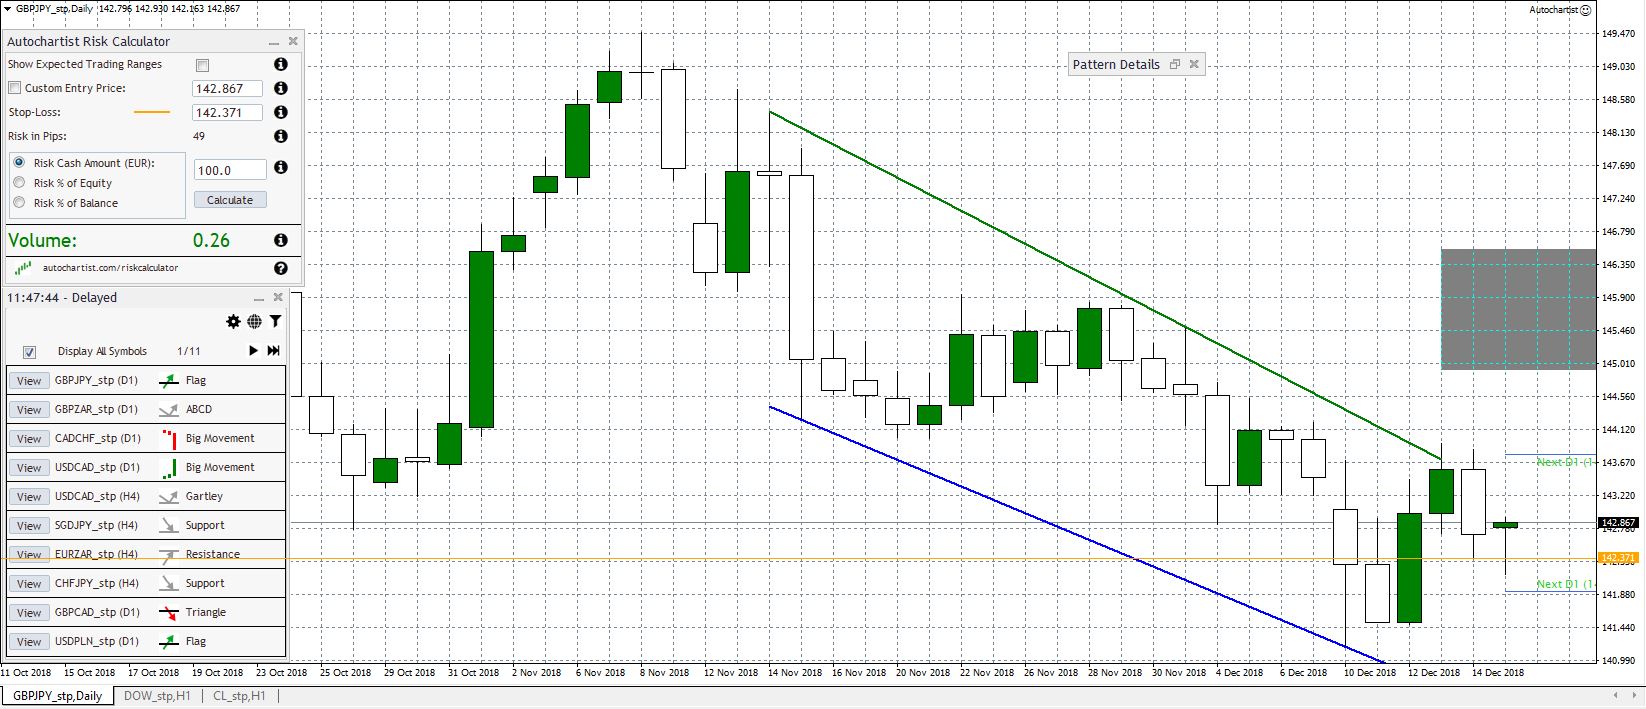
Trade opportunity forecast zones: As you can see on the right side of this picture, the trade opportunity forecast zones are displayed as a gray field. This indicates the direction toward which should be price developing in the future.
CUSTOMIZE YOUR SEARCHES BASED ON YOUR TRADING STYLE: With Autochartist you can customize displayed information by defining your search criteria based on your own personal trading style. It doesn’t matter if you are a breakout or swing trader, Autochartist automatically plots both support and resistance lines.
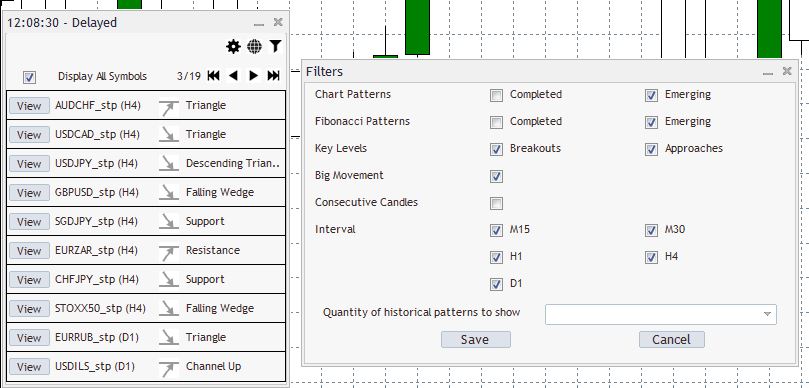
As you can see filtering out undesired data formations is really simple.
WORKS ON DEMO ACCOUNTS: You can try out Autochartist even if you don’t have Live account with Axiory. Just open our Demo account and follow the same installation routine as described below. There is only one disadvantage - using Autochartist on Demo account comes with 5 candle delay.
How to use
You can also use Autochartist on Demo accounts as well but there’s a 5 candle delay.
Features
Fibonacci patterns
Principle of these patterns is to give preview of where trader might expect next resistance or support lines based on Fibonacci ratios on a price scale. Autochartist identifies 6 different types of Fibonacci patterns based on the number of turning points, these are:
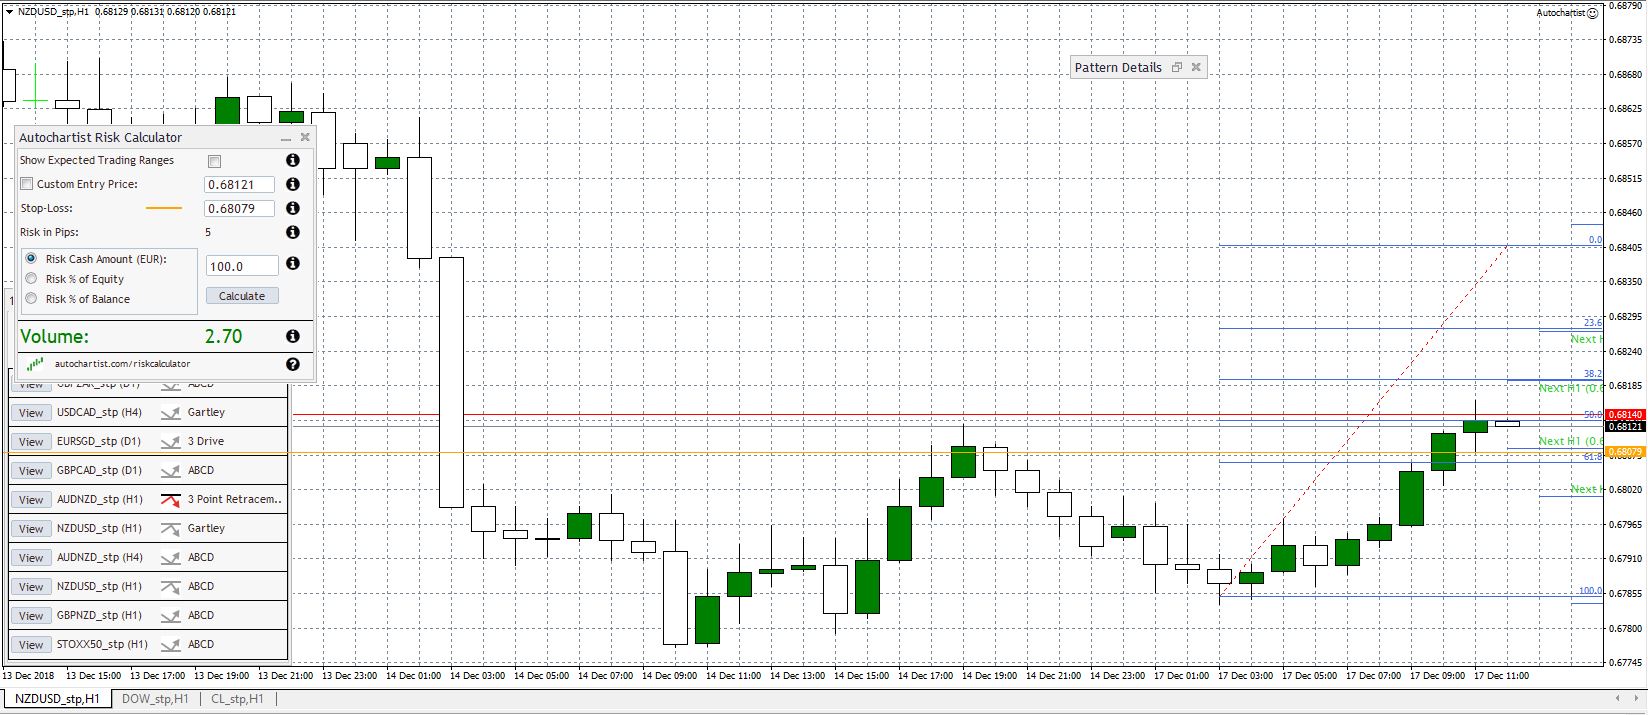
- 3 point retracement
- 3 point extension
- ABCD
- Gartley
- Butterfly Drive These are just few examples of how Autochartist draws Fibonacci patterns straight into trading platform. You can learn more about this feature in the educative videos.
Fibonacci pattern Gartley
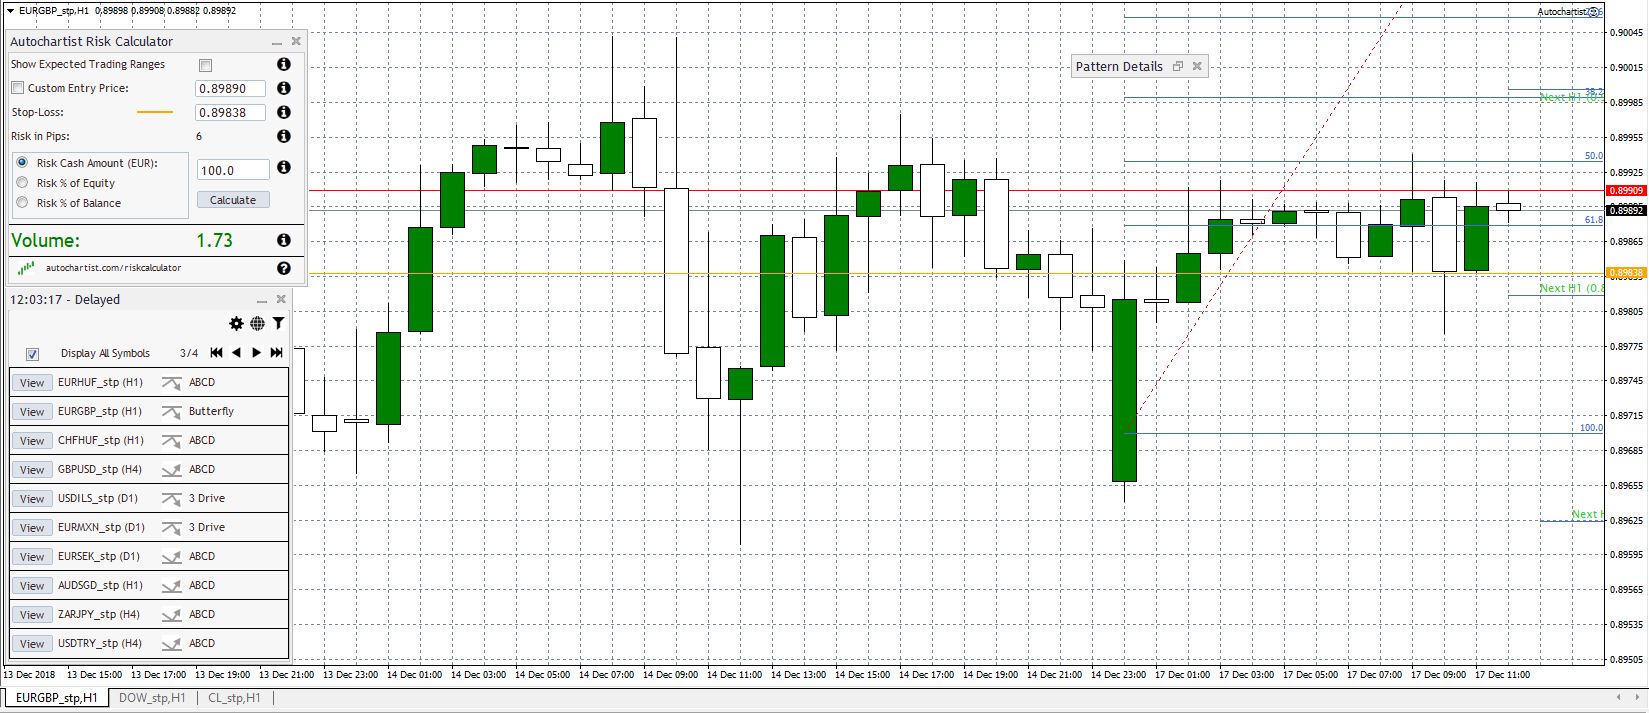
Fibonacci pattern Butterfly
Fibonacci pattern ABCD
Chart patterns
These pattern formations are based on market psychology according to which support and resistance lines are drawn. It’s a combination of these opposing lines with price moving in between them that defines each pattern formation, which eventually recognizes potential market opportunities. In total, Autochartist is able to recognize 16 chart patterns based on the slope of the support or resistance lines, which will give you yet another advantage for your trading.
Key levels
Whenever price touches horizontal support or resistance lines, a touching point is identified, after at least 3 touching points are being recognized on the same line, the key level is identified. With the increasing number of touch points, significance of key level also rises. This can help traders with either identifying potential trade opportunities or setting stop-loss or take-profit levels and therefore ultimately assessing their risk.
Volatility analysis
This small set of tools helps traders to observe past volatility of an instrument and also price forecast for the hours to come. Based on this information traders can effectively set stop-loss or take-profit levels or build their personal trading strategy.
Quality indicators
As there is always a chance that Fibonacci patterns, Chart patterns, and Key level results can be misleading, traders should use them together with their own trading judgment and not rely on them fully. That’s why Autochartist comes also with Quality indicators which determine the reliability of these tools and display it in easy to read and user-friendly way.
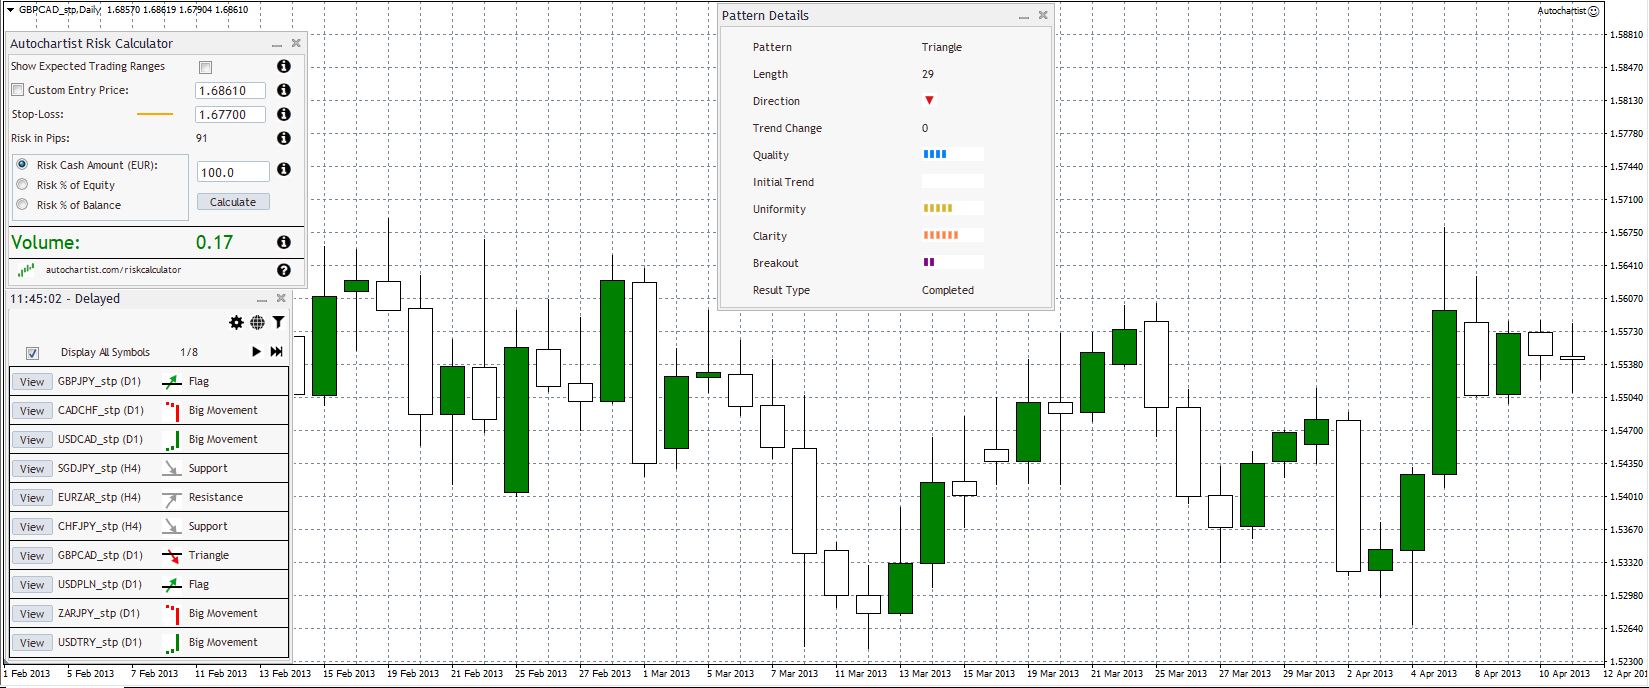
As you can see there are several quality indicators for chart patterns, in this case you are looking at quality evaluation of triangle chart pattern.
There are many reasons to pass up a trading opportunity but there are not many reasons to pass up an opportunity of having such powerful service as Autochartist available for your trading.
OPEN REAL ACCOUNT AND EARN AUTOCHARTIST FOR FREE
Your Capital is at Risk.
How to install
Windows
- Choose your language and download the plug-in here:
- Click next on Autochartist MT4 expert advisor setup
- Accept license agreement & Click Next
- Select a platform on which you want Autochartist to be installed
- (Click on “Add additional” if your platform is not on the list)
- Click next and then click Install
- Click Finish after the installation process is completed
- Relaunch your MT4 platform
Mac (Installation process for Mac users is somewhat more difficult.)
- Download this file
- Open the Terminal (cmd + space and type in “Terminal”)
- Copy & paste following command into the Terminal and hit “Enter”
a) If you are using OS X 10.9 or later:
“defaults write com.apple.finder AppleShowAllFiles -boolean true ; killall Finder”
b) If you are using OS X 10.8 or earlier:
“defaults write com.apple.finder AppleShowAllFiles TRUE ; killall Finder”
- At this point, hidden files and folders should become visible
- Open “Macintosh HD” → “Users” → “Your username” → “Library” (right-click and select open in new tab) → “Application Support” → “com.AxioryGlobal.MT4_123456” → “drive_c” → “Program Files” → “Axiory MetaTrader 4” → “MQL4”
- Copy & paste your downloaded file “MQL4” with the indicator to “Axiory MetaTrader 4” folder (replace the MQL4 folder with the new dowloaded one)
- Restart the MT4 and it should work now
- You can find Autochartist under “Expert advisors” in the navigator window At this point you need to enable Web requests by following these steps:
- Click on Tools in the menu item
- Click Options
- Click Expert advisors tab
- Tick the box next to “Allow WebRequest for the listed URL”
- Double click on “add new URL” and paste or type following web addresses:
- Autochartist should be now ready for use in your MT4 platform
At this point Autochartist should be installed, please open it.
Start Here
Be where "human to human" approach is a reality
Try Demo AccountOpen Real AccountYour Capital is at Risk.