Currency Indices
Available starting 26th of August 2019
Axiory offers currency indices for all major FX symbols to all of our users.
The currency index reflects the value of certain currency while monitoring and measuring the changes in exchange rates of the relevant currency pairs. As a result, this kind of index allows traders to evaluate how much certain currency strengthened or weakened compared to other currencies over time.
What Currency Indices Do We Offer?
Axiory is offering US Dollar Index (which we call DXY) and synthetic indices for all major currencies (JPYX, USDX, EURX, GBPX, AUDX, CADX, CHFX)
These symbols cannot be traded. These tools are being introduced that can help traders make decisions, evaluate potential entries and exits, or just extra source of information that they can incorporate into their trading strategies.
US Dollar Index (DXY) vs Synthetic Currency Indices
US Dollar Index (DXY)
The value of price of US Dollar Index (in our platform, under the symbol DXY) is set by using the weighted method for basket. It distributes the value of certain currency against all of its counterparts within a set time period.
It is comprised of five different currencies (EUR, JPY, GBP, CAD, SEK, CHF), with the EUR playing the dominant role in the calculation.
Example of DXY index calculation:
| COUNTERPART IN THE PAIR | WEIGHT IN THE INDEX (USDX) |
|---|---|
| EUR | 0.576 |
| JPY | 0.136 |
| GBP | 0.119 |
| CAD | 0.091 |
| SEK | 0.042 |
| CHF | 0.036 |
| Value of fixed coefficient | 50.14348112 |
DXY = 50.14348112 * EURUSD^-0.576 * USDJPY^0.136 * GBPUSD^-0.119 * USDCAD^0.091 * USDSEK^0.042 * USDCHF^0.036
US Dollar Index was formed in 1973. The comprised currencies were chosen according to the value of trade with their respective countries. At its start, the default value of the DXY was set to 100. Since, it reached the maximum value of 164.7200 (02/1985) and the minimum of 70.6980 (03/2008).
Some critics have raised objections that the currencies that form the US Dollar Index should be re-evaluated since major current trading partners of the USA are not included (China, Mexico, South Korea, Brazil), whereas currencies of countries such as Sweden and Switzerland still remain a part of it.
Synthetic Currency Indices
Beside the standard US Dollar Index (DXY), Axiory also offers 7 so-called synthetic currency indices. At Axiory, you can notice them by seeing the letter X at the end of the symbol. These include all major currencies, specifically: JPYX, USDX, EURX, GBPX, AUDX, CADX, CHFX
The major difference between the synthetic currency indices and the official index such as US Dollar Index (DXY), is that Axiory takes into account each and every currency pair in which the respective currency is traded. Therefore, they are not comprised of only the six chosen currencies as is the case with DXY.
Axiory uses a complex formula to calculate the value of each available index.
As you may have noticed, for US Dollar, Axiory offers both standard US dollar Index and a synthetic one.
Here is how the look compared together:
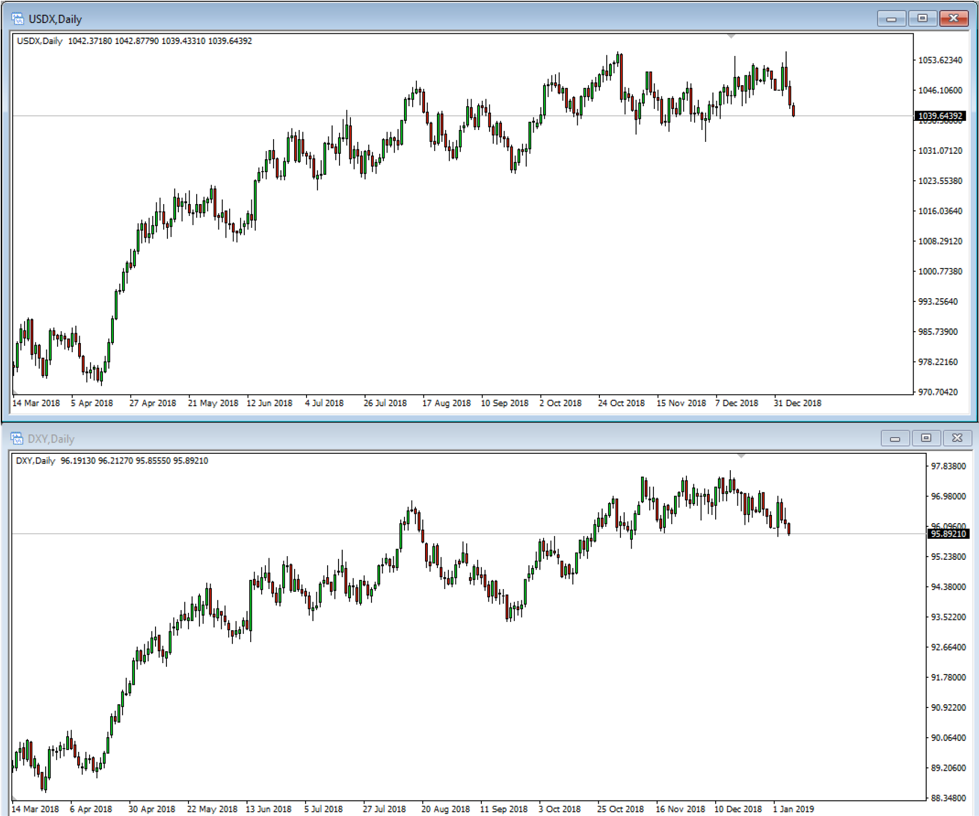
In many cases, their value is quite comparable. It is up to the trader to decide which one is better suited to their trading strategy.
How Can They Be Used?
In Axiory MT4 terminals, the currency pairs are shown among the other symbols (if you can’t see them, please try right-clicking on the Market Watch and selecting Show All). However, as we stated above, they cannot be traded and serve as an evaluation tool for the current strength of the currency.
Below are two examples where currency indices might be useful as a tool for traders.
1. Using downtrend and uptrend on two different indices to open a position
For this example, we have chosen the Australian Dollar index (AUDX) in combination with US Dollar index (USDX).
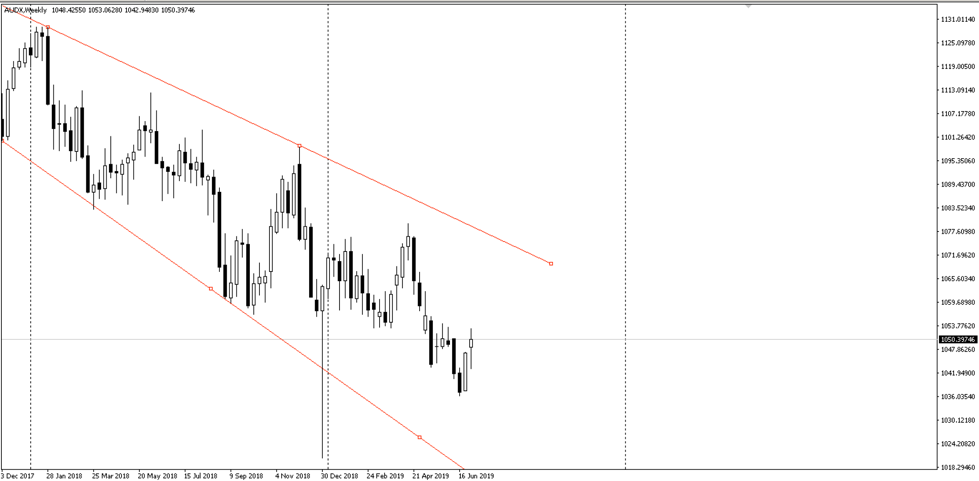
On the picture above, we can see that the strength of the Australian dollar is in a downtrend on the weekly chart. This gives us some idea on how the currency is doing in comparison with other currencies according to the formula above.
Now, let’s take a look at the US Dollar Index (USDX)
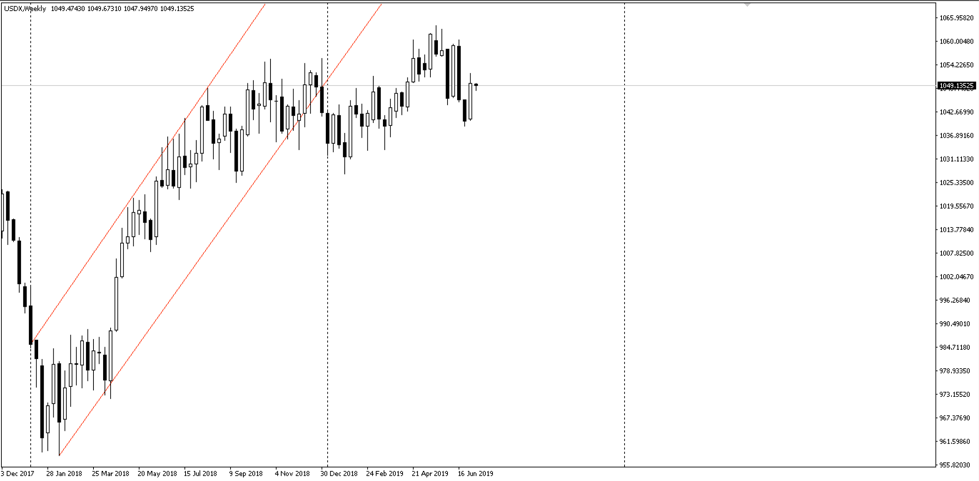
Chart shows us a strong uptrend for US Dollar.
Assuming we believe that the trend will hold and we would like to try to capitalize on it by opening a short position on AUDUSD, we could wait for the price to reach the upper part of a newly formed downward channel to try to enter at the best price.
To correctly set-up an exit from this position, we could use basically any touch at the bottom of the channel, depending on the risk appetite and any other used analysis that traders chooses.
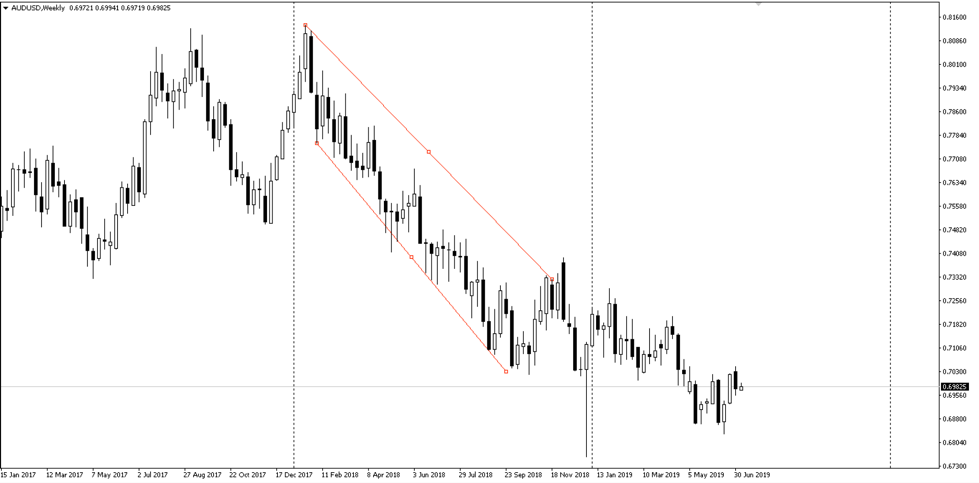
2. Using a long-term channel to help predict movement after a break-out
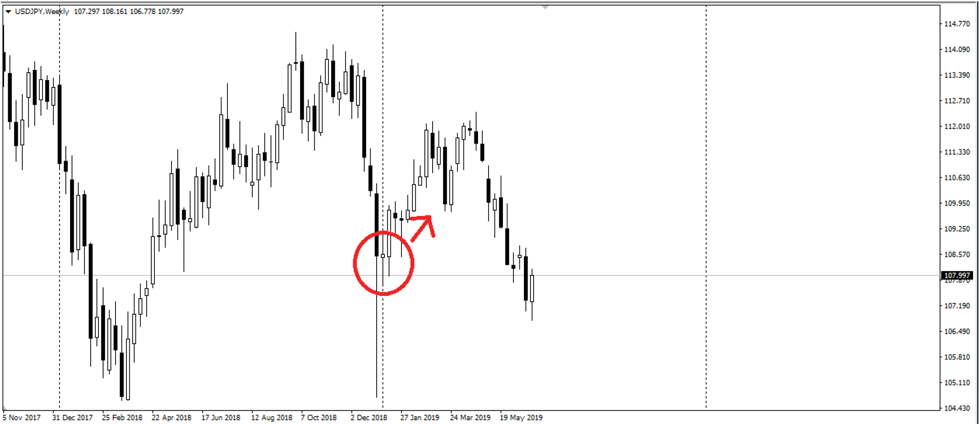
In the second example we’re using the JPYX index to enter a trade. On the picture below, you can see that JPY currency formed a channel that have been going on for longer than 9 months.
There has been a crash on the JPY in January 2019 that caused a break-out which could present us with a trading opportunity. If we believe that the long-term strength of the JPY will come back to the values it held for almost a year, we could’ve opened a long position on USDJPY immediately following the crash.
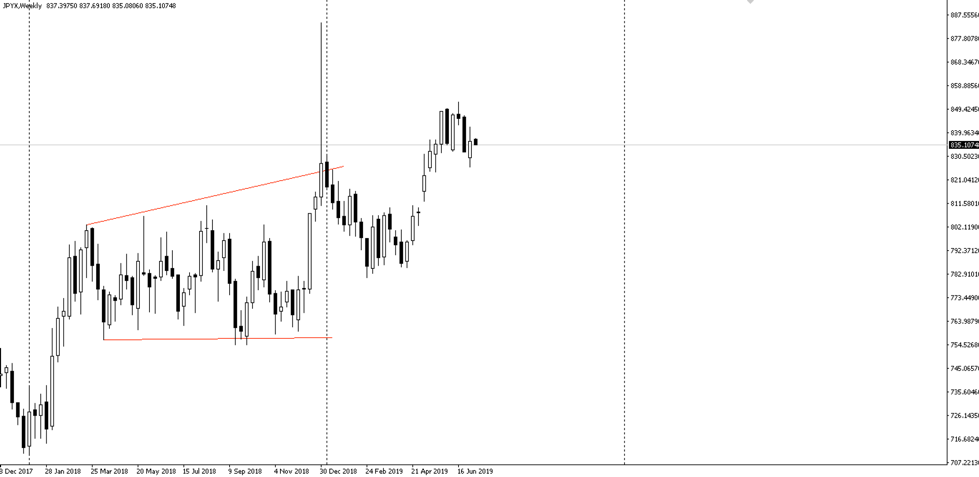
As we can see, the channel didn’t hold as nicely in the 2019, as it did during 2018. However, JPY still reversed enough
DISCLAIMER: The information written and charts displayed above are considered to be examples of potential use cases of these featured tools. In no way should the above information be considered as or constitutes trading advice. The information written above is to be considered an example of potential use-cases of this product. In no way it constitutes trading advice.
Start Here
Be where "human to human" approach is a reality
Try Demo AccountOpen Real AccountYour Capital is at Risk.